CryptoQuant Identifies Bitcoin's Bear Market Floor at $55,000
📊 The $55,000 Threshold: CryptoQuant's Bottom Call CryptoQuant has identified Bitcoin's potential bear market bottom at approximately $55,000, based on the asset's realized price metric. The realized price represents the average cost basis at which all bitcoins last moved…
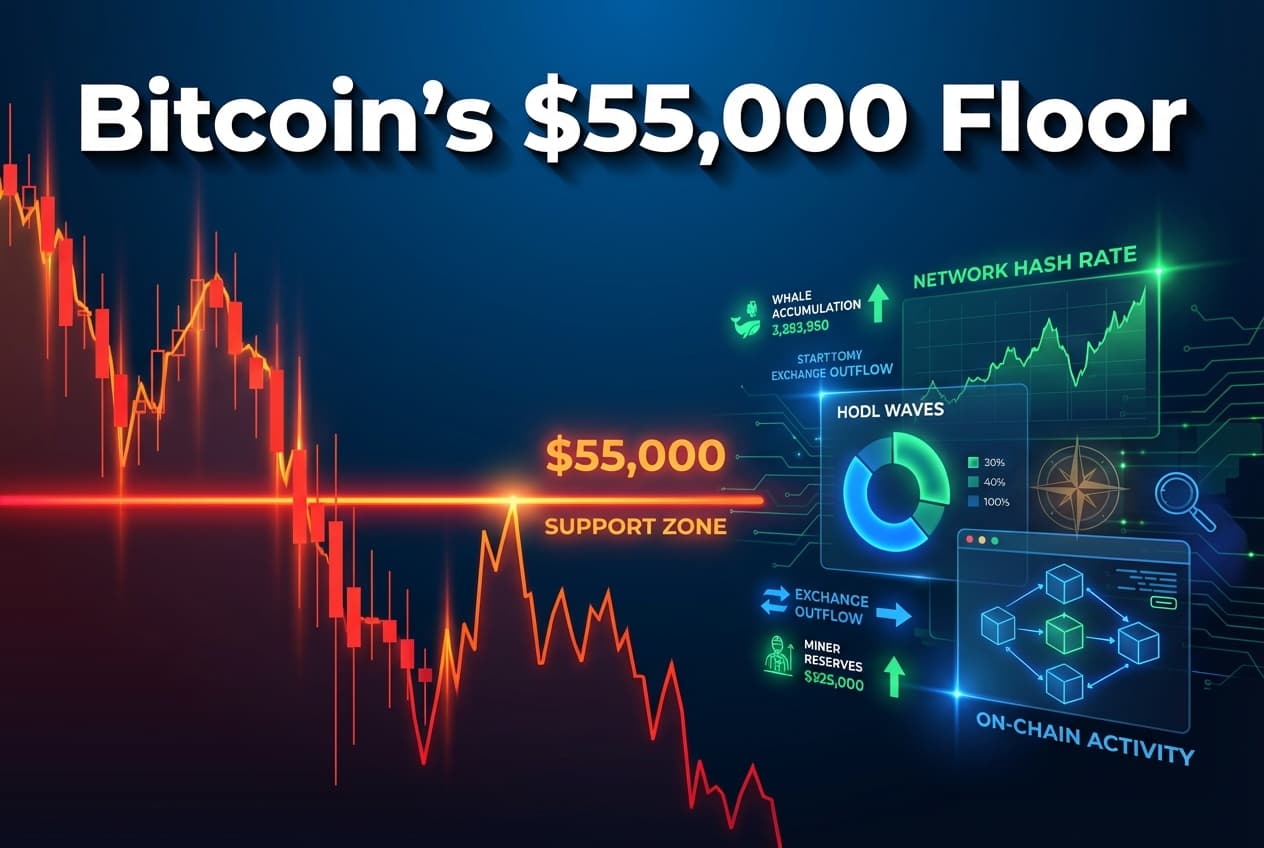
📊 The $55,000 Threshold: CryptoQuant's Bottom Call
CryptoQuant has identified Bitcoin's potential bear market bottom at approximately $55,000, based on the asset's realized price metric. The realized price represents the average cost basis at which all bitcoins last moved on-chain, essentially tracking the collective purchase price of the entire network. Bitcoin currently trades about 25% above this critical $55,000 level, a margin that has historically marked the transition zone between bear market lows and recovery phases. According to CryptoQuant's analysis, this metric has proven reliable in previous cycles, offering investors a data-driven floor estimate. The firm's research suggests that while Bitcoin may test lower levels, the $55,000 zone represents the ultimate downside target for this correction. For traders seeking entry points, this analysis provides a framework for understanding potential support levels during the current market weakness.
📉 Historical Precedent: How Past Bear Markets Found Their Floors
Previous Bitcoin bear cycles have consistently bottomed when prices fell 24% to 30% below the realized price, establishing a pattern that CryptoQuant applies to current market conditions. During the 2022 bear market following the FTX collapse, Bitcoin dropped 24% below its realized price before forming a durable bottom. The 2018 cycle saw an even deeper capitulation, with prices falling 30% below realized price and spending four to six months consolidating at those depressed levels. The 2015 bear market produced an 86% retracement lasting 406 days, while the 2017 cycle witnessed 364 days and an 84% decline from peak to trough. Bitcoin's recent decline from its cycle peak near $126,000 to the $60,000–$70,000 range marks a roughly 52% drawdown, which aligns with historical patterns but falls short of the extreme capitulation seen in previous cycles. These historical comparisons suggest the current correction may have further to run before matching the severity of past bear markets.
🔴 Missing Capitulation Signals: Why the Bottom May Not Be In
Despite the significant correction, several key indicators suggest Bitcoin has not yet experienced the full capitulation event that typically marks bear market bottoms. Monthly cumulative realized losses currently stand at 0.3 million BTC, substantially below the 1.1 million BTC recorded at the end of the 2022 bear market, indicating that forced selling has not reached panic levels. CryptoQuant's Bull-Bear Market Cycle Indicator remains in the Bear Phase rather than the Extreme Bear Phase, which historically signals the beginning of extended bottoming periods. The MVRV ratio, which compares market cap to realized cap, has not entered the extreme undervaluation territory that characterized previous bear market lows. Bitcoin holders realized $5.4 billion in daily losses on February 5 when prices fell 14% to $62,000, representing the largest single-day loss event since March 2023. However, this selling pressure has not yet matched the sustained capitulation witnessed during the 2022 FTX crisis or the 2018 bear market. For investors, these incomplete capitulation signals suggest caution is warranted despite the substantial price decline already witnessed.
⚙️ Understanding Realized Price: The On-Chain Metric Behind the Forecast
The realized price metric calculates the value of all bitcoins at the price they were last transacted on-chain, divided by the total circulating supply, providing an aggregate cost basis for all network participants. Unlike market prices that reflect current trading activity, realized price tracks actual transaction values, offering insight into when holders are experiencing profit or loss. When Bitcoin's market price exceeds realized price, the network is profitable in aggregate, while prices below realized price indicate widespread unrealized losses across holders. This metric becomes particularly valuable during bear markets, as it identifies support levels where long-term holders accumulated their positions and may be unwilling to sell at a loss. The Short-Term Holder Realized Price currently sits around $113,000, close to Bitcoin's recent trading range, while the overall network realized price anchors at $55,000. These dual metrics create a framework for understanding different cohorts of holders and their break-even points. For retail investors, tracking realized price provides a quantifiable measure of market sentiment and potential support zones that complement traditional technical analysis.
🎢 The Four-Year Cycle: Timing and Expectations for Recovery
Bitcoin's historical four-year halving cycle has consistently delivered 50% to 80% drawdowns following cycle peaks, a pattern that frames current market conditions within a predictable timing structure. The most recent halving occurred in April 2024, placing the market approximately 22 months into the post-halving phase where volatility and corrections are common. Historical precedent shows that bear markets typically require six to 12 months and involve multiple failed rallies before establishing a sustainable bottom. Since mid-January 2026, the Spent Output Profit Ratio has hovered around or below 1, indicating that sellers are realizing losses in a phase known as capitulation. The Cap Loss Ratio, which compares realized cap to market cap during periods of network-wide distress, has begun to spike but has not yet reached the extreme levels witnessed in 2015 when it exceeded 0.5. Forecasting models based on current on-chain values suggest a potential bear cycle floor in the $80,000 range by the end of 2026, with upside targets potentially reaching $160,000 to $200,000 once recovery begins. For long-term investors, the four-year cycle framework suggests patience during this correction phase, as historical patterns indicate that durable bottoms form slowly rather than through sharp V-shaped reversals.
🎯 Conclusion: Navigating the Road to $55,000
CryptoQuant's $55,000 bear market bottom call provides a data-driven framework for investors navigating the current correction, anchored in the realized price metric that has proven reliable across multiple cycles. While Bitcoin's 52% decline from its cycle peak aligns with historical patterns, the absence of full capitulation signals suggests the market may test lower levels before establishing a durable bottom. The realized price at $55,000 represents a critical support zone where the aggregate cost basis of all Bitcoin holders converges, creating a natural floor where long-term participants may step in to accumulate. Historical comparisons to 2015, 2018, and 2022 bear markets indicate that bottoming processes take months rather than days, with multiple retests and failed rallies common before sustained recovery begins. For traders, the current environment favors patience and strategic accumulation near key support levels rather than attempting to catch falling knives during capitulation events. As Bitcoin continues to respect its four-year halving cycle, investors should view the road to $55,000 not as a catastrophic failure but as a natural correction within a broader bull market structure. The on-chain data suggests that while the bottom may not yet be in, the downside is increasingly defined and measurable, offering risk-aware investors a roadmap for navigating the months ahead.
Sources
https://blockonomi.com/cryptoquant-places-bitcoin-bear-market-bottom-at-55000-as-key-indicators-show-extended-correction-ahead/ https://cryptonews.com/news/cryptoquant-bitcoin-ultimate-bear-market-bottom-55000/ https://decrypt.co/358083/bitcoin-down-bad-hasnt-hit-ultimate-bear-market-bottom https://www.newsbtc.com/bitcoin-news/are-we-near-a-bitcoin-bear-market-bottom-history-offers-a-framework/ https://cryptoquant.com/asset/btc/summary https://www.bitcoinmagazinepro.com/charts/realized-price/ https://calebandbrown.com/blog/bitcoins-market-cycle/
Market Munchies and Mode Mobile communications are for informational purposes only, and are not a recommendation, solicitation, or research report relating to any investment strategy, security, or digital asset. All investments involve risk including the loss of principal and past performance does not guarantee future results.
Any information contained in this commentary does not purport to be a complete description of the securities, markets, or developments referred to in this material. The information has been obtained from sources considered to be reliable, but we do not guarantee that the foregoing material is accurate or complete. There is no guarantee that any statements or opinions provided herein will prove to be correct.
Get fresh insights, breaking news, and hidden gems in the world of crypto—delivered straight to your inbox with our Crypto Cookies newsletter. Don't miss out—sign up now and get your first bite of insider knowledge!