Gas Just Hit $4.45 a Gallon Nationally. In California, It's $6. Here's Who's Paying the Most.
The national average price for a gallon of regular gasoline hit $4.48 this morning, according to AAA — up from $4.45 on Monday. In California, the state average has officially breached $6.13, while a reporter covering the Milken Institute Global Conference noted passing a $6…
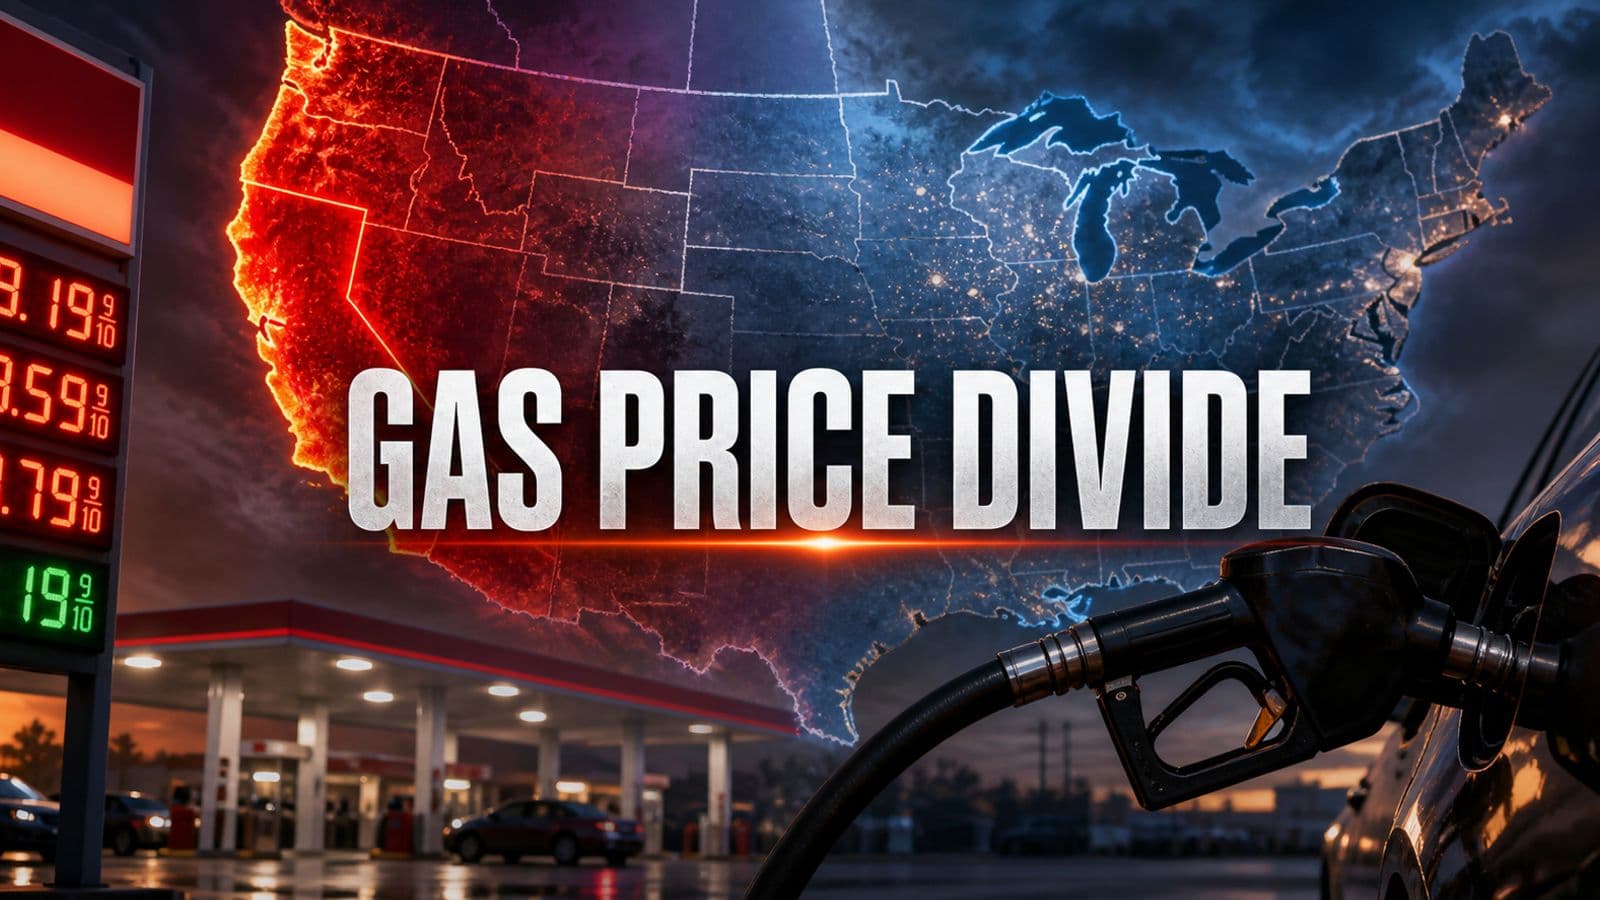
The national average price for a gallon of regular gasoline hit $4.48 this morning, according to AAA — up from $4.45 on Monday. In California, the state average has officially breached $6.13, while a reporter covering the Milken Institute Global Conference noted passing a $6 sign on the way in from the airport over the weekend. Both numbers are accurate. Neither one tells the full story.
The Iran war's energy shock has now been running for 66 days, and its fingerprints are visible across every state in the country. Gas prices saw double-digit percentage increases in every single state between April 2025 and April 2026. In some states, the increase exceeded 40%. The national average has risen nearly 30% in twelve months. But the distribution of that pain is not even, and the regional divergence has direct implications for consumer spending, household budgets, corporate earnings models, and the political economy of the energy shock heading into summer.
The Regional Divide
The price of a gallon of regular unleaded gas today ranges from approximately $3.38 in Oklahoma to nearly $6.00 in California — a spread of more than $2.60 per gallon between the cheapest and most expensive states in the country. That gap is not new, but the war has widened it in ways that matter.
The most expensive markets are concentrated in the West. California leads at approximately $5.84 to $5.89 per gallon, followed by Hawaii at $5.65, Washington at $5.39, Oregon at approximately $5.00, and Nevada at $4.94. All five states were already structurally expensive before the war began — California due to its unique fuel blend requirements, state taxes, and limited refinery connections to Gulf Coast production; Hawaii and Alaska due to transportation costs; Washington and Oregon due to a combination of state taxes and Pacific Coast supply chain constraints.
The Iran war has amplified every pre-existing disadvantage. California's fuel blend requirements mean it cannot simply import cheaper fuel from adjacent states during a supply crunch. Its refinery capacity is geographically isolated from the Gulf Coast pipeline network that supplies most of the country. When global crude prices spike, California absorbs a disproportionate share of the increase because it has fewer structural buffers.
At the other end of the spectrum, Oklahoma drivers are paying approximately $3.38 per gallon, followed by Kansas at $3.47, Iowa at $3.55, Nebraska at $3.55, and Arkansas at $3.59. The central and southern states benefit from proximity to Gulf Coast refining capacity, lower state fuel taxes, and supply chains that are less disrupted by the Hormuz closure than Pacific-facing markets. Texas, despite being an oil-producing state, has seen prices climb to approximately $3.98 — still well below the national average, but rising faster than most Gulf Coast peers as refineries in the region increasingly prioritize high-margin jet fuel production for military and international markets over domestic gasoline supply. That shift in refinery output mix is quietly eroding the Gulf Coast buffer that has historically insulated Southern consumers from global crude price shocks. The buffer is not gone, but it is narrowing.
The Gulf Coast states, including Texas, Louisiana, and Mississippi, consistently record some of the lowest average gas prices in the country precisely because they sit closest to the refinery infrastructure that processes domestic crude. That structural advantage has been a meaningful buffer against the Iran war's price shock — but it has not prevented double-digit year-over-year increases even in the cheapest markets.
The 40% States
The headline 30% national average increase conceals a more alarming story in specific states. Gas prices rose the most between April 2025 and April 2026 in Kentucky at 42.5%, Tennessee at 42.2%, and New Hampshire at 38.8%. These are not obvious candidates for the largest increases — they are mid-market states with no particular exposure to the California supply chain constraints or Pacific Coast logistics problems.
What Kentucky, Tennessee, and New Hampshire share is a starting point. They entered the Iran war period with relatively low gas prices, moderate fuel taxes, and supply chains that were assumed to be insulated from a Middle East disruption. Those assumptions were wrong. The Iran war's energy shock is not a regional event. It is a global crude price event that flows through every supply chain, every refinery, and every pump. States that thought their geographic distance from the Strait of Hormuz provided protection found that global crude prices do not respect state lines.
The states that saw the smallest increases — Nebraska at 18.4%, North Dakota at 18.6%, South Dakota and Minnesota both at 19.5% — were already paying closer to the midrange before the war began and have supply chains resilient enough to limit the pass-through. But even 18% in twelve months, against a backdrop of 3.5% broad inflation, is a significant real-terms squeeze on household budgets.
What $4.45 Actually Costs Households
The national average of $4.45 per gallon is an abstraction. What it translates to at the household level is more concrete.
The average American household drives approximately 15,000 miles per year in a vehicle averaging roughly 28 miles per gallon, consuming approximately 536 gallons annually. At $4.48 per gallon, that is $2,401 per year in fuel costs — up from approximately $1,687 at last year's $3.14 average. The increase is roughly $714 per household annually, or about $60 per month.
That $58 per month is not evenly distributed. For a household earning $100,000 annually, it is a noticeable but manageable cost increase. For a household earning $35,000 annually, it represents a 2% reduction in take-home pay going to the gas pump — in addition to higher heating costs, higher food prices, and higher utility bills driven by the same energy shock.
The distributional impact is the reason the Iran war's energy shock functions as a regressive tax. Lower-income households spend a larger share of their income on transportation and energy than higher-income households do. They are also less likely to own fuel-efficient vehicles, less likely to work remotely, and more likely to commute by car in areas with limited public transit. Every dollar of oil price increase extracts more from the bottom of the income distribution than from the top.
In California, the household math is considerably more brutal. At $6.13 per gallon, the same 536 gallons cost $3,286 annually — up from approximately $2,040 last year. The annual increase for a California household is closer to $1,246, or roughly $104 per month. In a state where the median household income is approximately $91,000 but the cost of living is among the highest in the country, that is not an invisible line item.
What the Regional Divergence Means for Corporate Earnings
The gas price divergence has direct implications for corporate earnings models that have not yet been fully processed by the market.
Consumer discretionary companies with concentrated exposure to California and the Pacific Coast — retailers, restaurants, entertainment venues, travel businesses — are facing a consumer that is absorbing a larger energy shock than the national average data suggests. A consumer spending nearly $100 per month more on gasoline in California is not spending that money elsewhere. Every dollar at the pump is a dollar not at the mall, not at the restaurant, not at the movie theater.
Regional airlines with heavy West Coast exposure face the same asymmetric pressure on two fronts: their fuel costs are elevated by high jet fuel prices, and their passenger base is absorbing a gas price shock that reduces the discretionary income available for leisure travel. Southwest's heavy California, Nevada, and Washington exposure makes it more sensitive to this dynamic than carriers with more balanced geographic footprints.
Conversely, companies with concentrated exposure to the South and Central states — where gas prices remain well below the national average despite significant increases — are seeing a consumer that is stressed but not experiencing the same acute squeeze. The Walmart customer in Oklahoma and the Walmart customer in California are both absorbing higher energy costs, but the Oklahoma customer is absorbing them from a much lower baseline.
The regional divergence in gas prices is not typically a variable that corporate earnings models build in granularly. Most consumer-facing companies model a national average and apply it uniformly. In a year where the spread between the cheapest and most expensive state exceeds $2.60 per gallon, that uniform modeling approach produces material forecast errors for companies with geographically concentrated customer bases.
What to Watch
The EIA releases its weekly gasoline price update this morning, which will provide the first official confirmation of whether Monday's $4.45 national average has held or moved further. The Hormuz ceasefire reassessment on Friday, May 8 is the next major catalyst: a deterioration in the diplomatic situation would push crude prices higher and flow through to pump prices within days. A credible de-escalation would do the opposite — though the pass-through from lower crude to lower pump prices typically takes two to three weeks to fully materialize.
The summer driving season begins Memorial Day weekend on May 23. Historically, summer demand pushes gas prices higher by an additional 10 to 20 cents per gallon as refineries transition to summer fuel blends and driving volumes increase. In a year where the national average is already at $4.48 and California has breached $6.13, that seasonal premium compounds an already acute situation.
There is an additional dynamic worth flagging for investors: refining crack spreads — the profit margin between crude oil input costs and finished gasoline output — are currently at record highs due to the Iran war's supply disruption. Elevated crack spreads mean that refineries are capturing an unusually large share of the pump price for themselves, which has two implications. First, pump prices can rise faster than crude prices when crack spreads are widening — a phenomenon traders call "rockets and feathers," where prices go up like rockets but fall like feathers. Second, when the Hormuz closes and crude eventually falls on a peace deal, the collapse in pump prices will likely lag the crude move by weeks as crack spreads normalize. For consumers hoping for quick relief at the pump after a ceasefire, history suggests the wait will be longer than the headlines imply.
Sources
- Empower — "Average gas prices by state: What Americans are paying to pump" (as of April 20, 2026): https://www.empower.com/the-currency/money/gas-prices-by-state-news
- LendingTree — "US Gas Prices Soar Nearly 30% Nationwide — Every State Hit With Double-Digit Increases" (as of April 15, 2026): https://www.lendingtree.com/credit-cards/study/gas-prices/
- SmartAsset — "Gas Prices Hit Records in 2026: State by State Breakdown" (as of April 1, 2026): https://smartasset.com/data-studies/gas-prices-spring-2026
- Motor1 — "Lowest & Highest Gas Prices By State: April 2026": https://www.motor1.com/features/773137/highest-lowest-gas-prices-usa/
- Washington Post — "Why these states have the lowest and highest gas prices": https://www.washingtonpost.com/business/2026/04/23/gas-prices-lowest-highest-by-state/
- Visual Capitalist — "Mapped: Gas Prices by State Right Now" (March 2026): https://www.visualcapitalist.com/mapped-gas-prices-by-state-march-2026/
- Yahoo Finance / Apollo — Jim Zelter at Milken Conference 2026 (California $6 gas observation): https://finance.yahoo.com/video/jim-zelter-on-whats-driving-the-market-outlook-from-milken-conference-2026-151827443.html
- CNN — "Day 65 of Middle East conflict: Trump says US having 'very positive discussions' with Iran" (national average $4.45): https://www.cnn.com/2026/05/03/world/live-news/iran-war-news
- U.S. Energy Information Administration — Gasoline and Diesel Fuel Update (weekly): https://www.eia.gov/petroleum/gasdiesel/
- AAA — State gas price averages (cited via LendingTree and Empower): https://gasprices.aaa.com/
Market Munchies and Mode Mobile communications are for informational purposes only, and are not a recommendation, solicitation, or research report relating to any investment strategy, security, or digital asset. All investments involve risk including the loss of principal and past performance does not guarantee future results.
Any information contained in this commentary does not purport to be a complete description of the securities, markets, or developments referred to in this material. The information has been obtained from sources considered to be reliable, but we do not guarantee that the foregoing material is accurate or complete. There is no guarantee that any statements or opinions provided herein will prove to be correct.