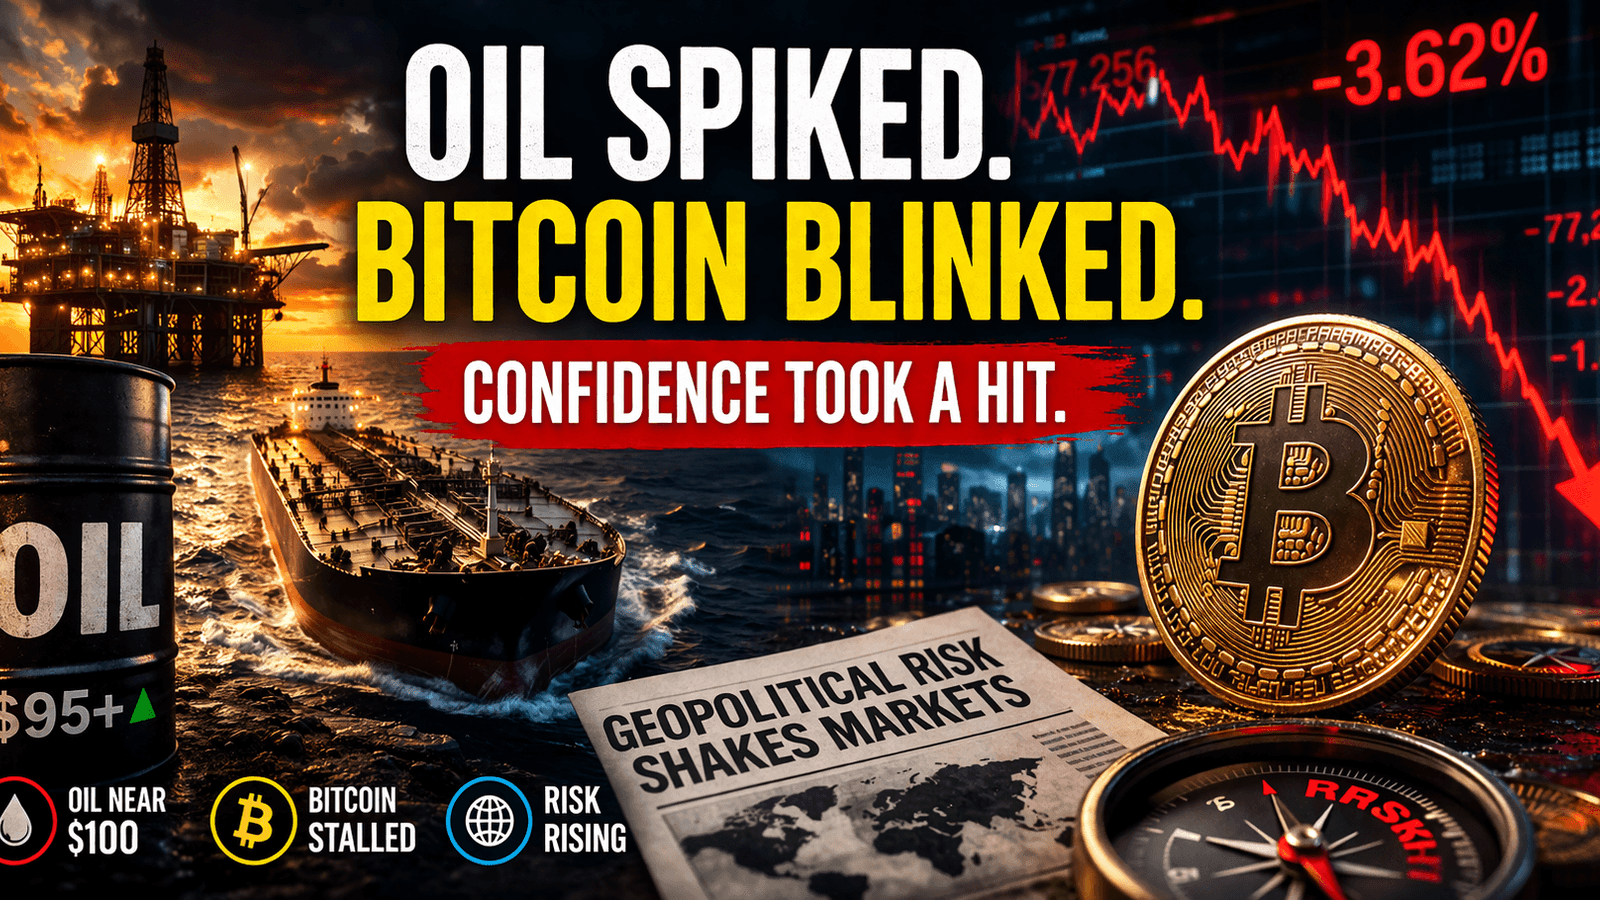
The Market’s Confidence Just Took a Hit—Oil Moved First, Bitcoin Followed
Ever Notice How Markets Don’t Panic First… They Hesitate? You're scrolling through charts expecting business as usual—maybe a steady grind higher, maybe a quiet breather. Instead, something feels… off. Oil suddenly jumps. Bitcoin pauses mid-run. Headlines start driving prices…
Ever Notice How Markets Don’t Panic First… They Hesitate?
You're scrolling through charts expecting business as usual—maybe a steady grind higher, maybe a quiet breather.
Instead, something feels… off.
Oil suddenly jumps. Bitcoin pauses mid-run. Headlines start driving prices more than data.
No crash. No chaos. Just a subtle shift in tone.
And if you've been around markets long enough, you know— Hesitation is often the first signal.
So what exactly just changed?
Bitcoin Hit Pause—Not Panic, Just a Reality Check
After recovering sharply from lows near $60,000 in February, Bitcoin has climbed back into the high-$70K range—and has been consolidating there with real resistance around the $80,000 level.
As of this morning, BTC is trading around $77,600–$79,000. Six consecutive days of positive net inflows into spot Bitcoin ETFs have totaled roughly $2.1 billion, with BlackRock's IBIT carrying the majority of that institutional bid. Cumulative net inflows into U.S. spot Bitcoin ETFs since launch now sit at approximately $58 billion, with total assets surpassing $102 billion.
But here's the nuance the headline numbers miss:
Bitcoin hasn't been acting like a hedge. It's been acting like a risk asset—moving with sentiment, not against it. On-chain data shows short-term holders using the ETF bid as exit liquidity near the $78,000–$80,000 zone. That's the trade: institutional inflows are real, but so is the distribution pressure they're absorbing at current levels.
💡 Smart Capital Signal: When Bitcoin pauses at key resistance despite strong ETF inflows, it tells you something important about the supply sitting just overhead—not about the long-term direction.
Oil Moved First—And It Didn’t Whisper
While crypto hesitates, oil has made a much louder statement.
Brent crude is trading around $106–$108 per barrel today, up roughly 65% from a year ago. That is not a slow trend. That is a war-driven supply shock playing out in real time.
The trigger is specific: the Strait of Hormuz has been effectively closed since late February, when the U.S.-Israel war on Iran began. The IEA has described this as the largest energy supply shock on record. Brent briefly reached $119 per barrel during the peak of active fighting in March; it has since pulled back as ceasefire hopes flickered—but remains deeply elevated.
Today's session is a live example of how sensitive oil has become to diplomatic signals. Prices jumped when Trump ordered negotiators to suspend discussions, then eased back after reports emerged of a new Iranian proposal via Pakistani mediators. As of this morning, the situation remains unresolved.
Citi has raised its 2026 Brent forecast to as high as $150 in a scenario where the strait stays blocked through late June. J.P. Morgan has flagged $120–$130 as realistic if disruptions persist past mid-May.
⚡ Tactical Insight: When oil rises on supply destruction—not demand—it's often the first domino in a broader macro shift. At $106+ per barrel, this isn't a warning signal anymore. It is the shift.
The Real Story: A Supply Shock Markets Are Still Pricing In
Here's where things get more serious.
The Strait of Hormuz normally carries roughly 20% of global oil flows. It has been largely blocked for nearly two months. The IEA estimates that approximately 13 million barrels per day of crude, condensates, and natural gas liquids remain effectively shut-in.
Experts have flagged a critical caveat: even if a deal is reached today, it could take months for oil flows to normalize. Mines laid in the strait add further complexity. The U.S. Navy has few minesweeping vessels in the region.
The chain reaction is unfolding in sequence, not theory:
- Oil prices surge → Transportation costs climb
- Fertilizer supply disrupted → Food inflation builds
- Goods become more expensive → Inflation lingers
- Central banks stay cautious → Growth slows
📡 Investor Radar: Markets have been pricing this as temporary. The risk is that it isn't. Even analysts who expect a deal warn that the supply gap has already been accumulating for weeks, and the economic damage from that overhang doesn't reverse on the day the strait reopens.
When Headlines Start Moving Markets, You Pay Attention
Something else quietly shifted over the past several weeks.
Markets are no longer waiting for scheduled data releases. They're reacting to live geopolitical developments—in real time, sometimes intraday.
This morning alone: oil jumped on news of stalled negotiations, then pared gains on reports of a new Iranian proposal. Bitcoin briefly crested $79,000 before pulling back as the Hormuz uncertainty reasserted itself.
Tanker incidents. Naval clashes. Diplomatic signals from Islamabad. Each headline now feeds directly into oil volatility, equity sentiment, and crypto behavior—within hours of breaking.
🔍 Risk Lens: When headlines move prices more than fundamentals, volatility becomes part of the baseline—not the exception. This is that kind of market. Trading around scheduled catalysts matters less than tracking the diplomatic newsfeed.
Everything Is Now Connected—Whether You Like It or Not
Take a step back, and the pattern is impossible to miss:
- Oil spikes → Inflation risk rises
- Inflation risk rises → Policy stays tight or pauses
- Policy uncertainty → Risk assets wobble
- Risk assets wobble → Bitcoin follows
There's no isolation anymore. Even Bitcoin—once pitched as an independent hedge—now dances to the same macro rhythm. Its correlation with geopolitical risk sentiment has been visible throughout this crisis: it sold off hard when the war began, recovered as ceasefire hopes emerged, and stalls again each time talks collapse.
That doesn't make it weaker. It just makes it… connected.
The Real Takeaway: Confidence Didn’t Collapse—It Just Cracked
Here's the nuance most investors miss.
Markets didn't fall apart. They just… lost a bit of certainty.
And that matters. Because once confidence cracks—even slightly—pricing starts to change. Risk gets reassessed. Positions get lighter. Narratives get questioned.
The S&P 500 is actually back near record levels, having recovered from the initial war shock in just 11 trading days. Bitcoin ETF inflows are the strongest they've been in months. On paper, things look composed.
But beneath that surface: oil near $107, a strait still largely closed, ceasefire negotiations stalled again as of this morning, and an entire global supply chain still recalibrating around a conflict that has now entered its ninth week.
🧩 Closing Reflection: The market didn't panic. It blinked.
And if you're paying attention, that blink tells you everything: we've entered a phase where risk isn't ignored—it's being repriced in real time, every single day, one headline at a time.
Sources
- Investopedia – Oil price surge and geopolitical tensions
- Barron’s – Bitcoin price resistance near $80K
- Economic Times – Bitcoin inflows and price movement
- Economic Times – Bitcoin consolidation phase
- BeInCrypto – Bitcoin resistance and market behavior
- Business Insider – Market risks tied to geopolitical tensions
Market Munchies and Mode Mobile communications are for informational purposes only, and are not a recommendation, solicitation, or research report relating to any investment strategy, security, or digital asset. All investments involve risk including the loss of principal and past performance does not guarantee future results.
Any information contained in this commentary does not purport to be a complete description of the securities, markets, or developments referred to in this material. The information has been obtained from sources considered to be reliable, but we do not guarantee that the foregoing material is accurate or complete. There is no guarantee that any statements or opinions provided herein will prove to be correct.